Small recap: the idea was to have particles that vibrated (expand/contract) between size 1 -> 10
When they expand they push other particles away, and when they contract they pull other particles towards them. (Attraction-Repulsion Forces)
The simulation would begin with a random distribution and the idea was that particles with the same timing would align, form groups and a Voronoi-Pattern would self-emerge.
The idea is similar to the
Kuramoto Model, think of metronomes placed on a rolling plate that start synchronise:
“A mathematical model used in describing synchronization. More specifically, it is a model for the behavior of a large set of coupled oscillators.”
The difference with my model was that in the Kuramoto model particles adjust their period to each other, while mine they keep their fixed period*.
————
The first results didn’t produce the desired result. Particles would contract into Voronoi-cells but each time they expanded, and contracted-back different new groups were formed. So the Voronoi-patterns weren't stable.
To solve this we added two extra features:
1. Groups
The first feature made it possible to multiple groups of particles of which we can adjust: size, vibration rhythm and give each group a percentage of the total amount of particles.
a) Large group (72%) of small Blue particles ; b) Small group (20%) of large White particles; c) Small group (8%) in-between sized Red particles.
Why multiple sized groups?
In the beginning Space is a dense medium wherein oscillations emerge randomly.
The first wave has all the freedom and can cover wider areas.
Second waves are limited by the pressure caused the first wave and covers smaller areas.
2. Random
The second feature was to have the option to have all particles vibrate randomly or in synchrony.
————————————
These two new features lead to two discoveries:
1. Buffers
We used groups of particles with different sizes of particles:
• Small Blue ones: vibrating-size between 2 - 3 (72%)
• Larger White ones, vibrating-size 3 - 7 (20%)
Because of
Granular Convection the larger particles are pushed outside the group of small particles ...
… and form a Buffer between the cells:
These buffers prevent the smaller particles to contract each time into different cells, as a result we get stable cells.
———
2. Balancing vs Colliding Cells
In the simulation above with the buffers, the Blue-particles vibrate Random between 2 - 3
As a result one half the Blue-particles are expanding, while the others are contracting, and we get two vibration rhythms and a fluctuation between the two.
Both halfs of the group of Blue-particles keep each other in balance:
One is contracting vs the other is expanding.
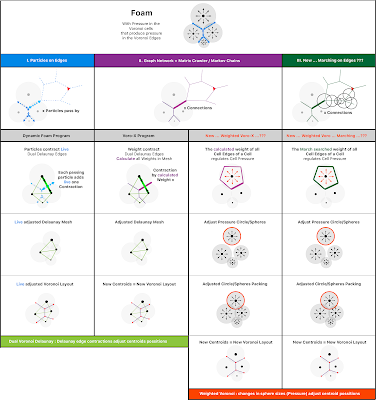
The problem with this balancing-act is that it flattens out the pressure in the simulation. Everything wobbles and there’s no pressure generated in the edges, which is needed for my concept of a Dynamic Foam:
were there are pressure-currents in the edges that are cut-off when angles are < 90°:
and circuits are formed.
It made us realise that we needed to get the cells moving in sync and have them collide simultaneously, so we have each time a pressure peak in the edges, and pressure has to spread out through the edges, perpendicular to the cells.
And this is exactly what happens when we Turn-off Random, see how the cells now collide:
There’s a tipping point above 1200 particles in this example, where the pressure is so high in the edges that we get 'crawler-errors', where the program 'mitigates' the overlapping particles.
It shows that pressure has to go somewhere (sideways through the edges).
———
Conclusion:
We can get stable Voronoi-patterns, but the idea of keeping their fixed period is wrong for my project, particles should sync like the metronomes in the Kuramoto-model.
Two differences between the Kumamoto model are the second group of larger Buffer-particles that stabilise the cells and the Attraction-Repulsion Forces.
When turning Random Off we get pressurised edges thanks to the colliding Voronoi-cells vs when Random is turned On, then the cells balance each other out.
The problem moving forward for this project are those ‘crawler-errors’ that don’t distribute the pressure correctly through the edges, so
we'll need to shift back to a mesh approach or a shader ...
To be continued.


