Intro
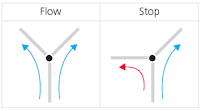
There’s a foam where flow runs through the edges, the angles of the junctions regulate if flow can pass or is not, the amount of current in an edge defines if its neighboring cells grow or shrink, like a river sedimentation vs erosion.
Scheme I : Technical setup
1. Random Poisson distribution (or Blue Noise) of points that fills the area.
2. Build the Delaunay Triangular Mesh with these points (see ref. Alterntives for Voronoi Diagrams)
3. Calculate the Barycenters/Centroids.
4. Build the Dual Voronoi Mesh.
5.a. Send pulses from the edges of the Voronoi Mesh in both directions.
5.b. Calculate from the triangles which Angles/Gates/Connections are: Open (I) > 90° or Close (0) < 90°
5.a./5.d. Keep forwarding the pulses through the edges so we get a current-value for each edge (until we reach a Steady-State).
6. The results of (5.a.) gives us the value of how much the Delaunay-edges should contract or expand (similar to a Mass-Spring system).
-> Now we are full-circle and we have new positions for (1.) and (2.), and we can draw a new set of (3.) Centroids and redo the whole process.
Scheme 2 : Divide Large Mesh in Small Blocks
Maybe we can cut up the ‘Global Mesh' in smaller blocks that can be easily parallel computing on the GPU, where the a edges fo the Global Grid/Mesh are separated into small blocks that have a Local ‘virtual’ Grid and are easy to process individually to be send back to the Global Mesh.
Scheme 3 : Iteration of Global Backbone and Local Blocks
The mesh could be divided into one Global horizontal strip with small Local blocks:
Y0 / Y1 / Y2 / Y3 / …
At each iteration there’s a vertical process where each block can figure out it’s local connectivity status, the results are fed into a Global graph that uses a Morkov-Chain process to figure out the connectivity ‘flow’ state of each connection, just like how Google’s Page-Rank works, and the results are fed back into the Global mesh.
Step 1 / Step 2 / Step 3 / ...


